
The SPM Concept
Processing of acoustic data from the raw records stored on the SD cards in each recorder to the detection and localization of acoustic signatures is a six-stage process. SPM implements all six stages and guides you through this sequence. But SPM is just the baseline tool. The data output at each stage is in an industry standard format including .wav, .csv, .json and .kml. This means you can 'break out' of the SPM sequence to use your preferred tools for any stage. For example, PAMGuard can be used to detect cetacean vocalizations at step 4, and Where's Whaledo for TDOA extraction (stage 5) and localization (stage 6).
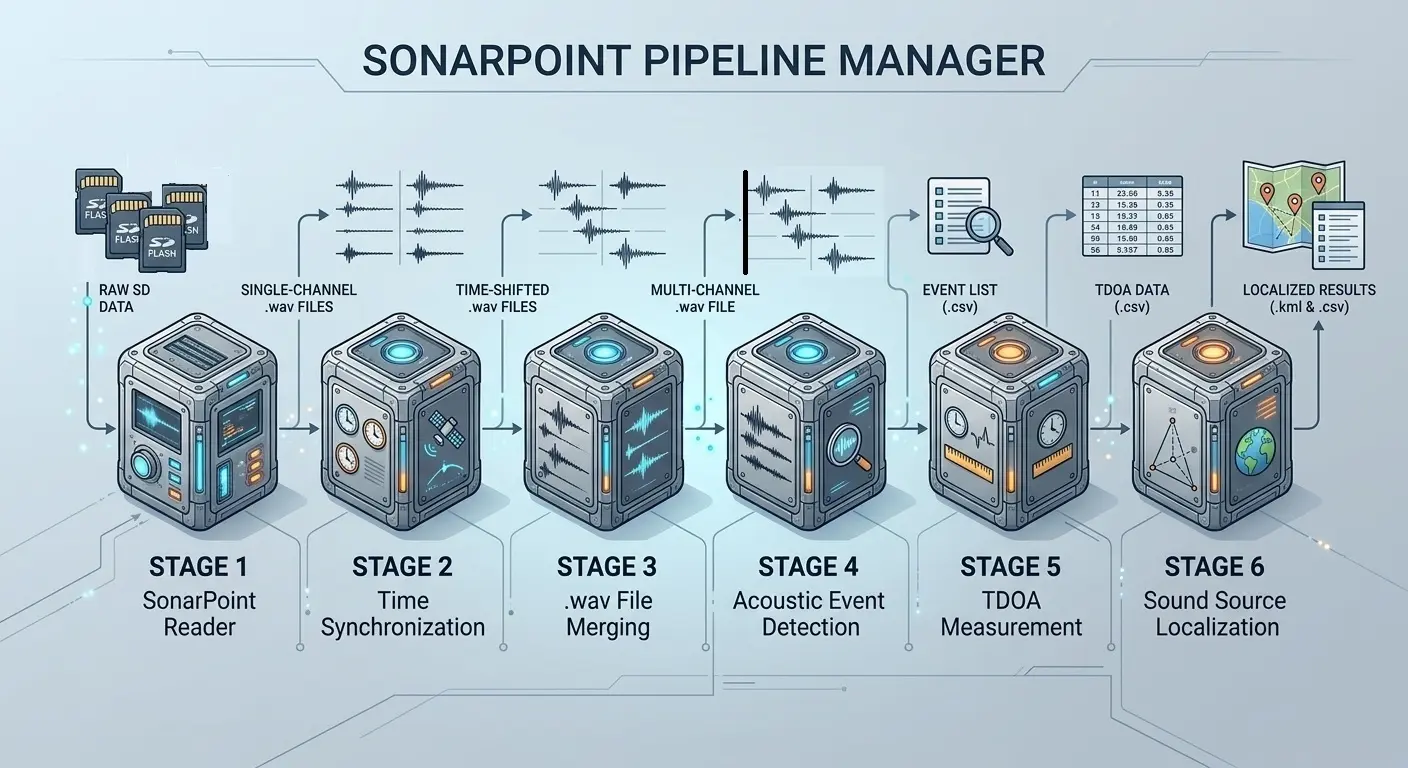
The six stages of SonarPoint data processing from raw acoustic data to localized positions
Stage 1 – Convert raw data to .wav
Each SonarPoint recorder stores its acoustic record in a compact raw format on up to eight SD cards. The record is split into recording segments, usually ten minutes long. SPM reads the cards over USB and converts each segment into a single-channel .wav file. Each file is named with the recorder's serial number and the segment's UTC start time.
Stage 2 – Time synchronization
Each recorder has a precision clock, but it can still drift by up to about 4 ms per day. That is equivalent to roughly 6 m of range error per day of deployment. Stage 2 measures each recorder's clock drift in one of two ways. The first uses a synchronization pinger mounted on one of the mooring strings. The second uses GPS-timed pinger checks before deployment and after recovery. Having two methods gives redundancy. The corrections for every file are written to a .csv table.
Stage 3 – Merge
Each single-channel file is shifted in time to cancel its clock drift. The files are then combined into one multi-channel .wav file per recording segment, with one channel per recorder. The array configuration file (.json) assigns recorders to channels. Missing recordings are filled with silence. A merge table (.csv) shows at a glance which recorders have data for each time period.
Stage 4 – Event detection
The merged files are reviewed to find the sounds of interest, such as whale song, echolocation clicks or other signatures. In SPM, event detection is manual. You describe each event by entering its start and end time, its lowest and highest frequency, and the channel it was detected on. These values usually come from viewing the .wav files in Audacity or a similar tool. SPM then writes the events to a standard .csv file for the next stage.
Manual detection works well for focused studies, but a long deployment can contain thousands of calls. This is a natural place to break out of the SPM sequence. PAMGuard's automated Whistle and Moan Detector, for example, can isolate thousands of cetacean calls, and its detections can be fed straight into stage 5.
Stage 5 – TDOA measurement and closure check
For each event, SPM measures the time difference of arrival (TDOA) at every recorder relative to the reference channel. It has two methods:
- Impulsive sounds such as clicks: a time-domain threshold method. It locks onto the first arrival, which is the direct-path signal, even when later echoes are louder.
- Tonal and swept sounds such as song: frequency-domain cross-correlation.
Stage 5 is also the first of two validation steps. Not every correlation peak is real. A recorder may lock onto a surface echo, a noise spike, or a different sound that happens to correlate. Each of these produces a phantom position that looks as valid as a true one. SPM catches this with a TDOA closure test . Because all the delays come from a single wavefront, the delays around any loop of three recorders must add up to zero. For example, TDOA 1→2 plus TDOA 2→3 must equal TDOA 1→3. A large closure error shows that the recorders did not all track the same sound, and the event is flagged before any position is calculated.
Stage 6 – Localization and residual check
The TDOAs are combined with the known recorder positions and the speed of sound. SPM searches a volume around the array, within each event's depth range, for the 3D position (easting, northing and depth) that best matches the measured TDOAs.
The remaining mismatch at that position, called the residual error, is the second validation step. It catches problems the closure test cannot see:
- Every recorder locking onto the same surface reflection. The loop still closes, but no real position fits the delays.
- An incorrect mooring position.
- An incorrect speed of sound.
Together, the two checks separate true positions from phantoms and show where an error came from. Each localization is validated on its own, so even a single, isolated call from a rarely vocalizing species can be positioned with confidence. Results come out as a .csv table and a .kml map that you can open in Google Earth. The map shows each sound source together with the mooring locations.
SPM as a baseline and cross-check
SPM gives you a complete, working path from raw recordings to validated positions. That's enough for basic work, and it's also useful for cross-checking results from other tools. Because every stage reads and writes standard formats, you can switch to your preferred tool at any stage and pick the SPM sequence back up afterward.